As part of its data visualization research, the US space agency NASA is experimenting with virtual and mixed reality at its Jet Propulsion Laboratory (JPL) in Southern California. The aim is to improve the analysis and interpretation of complex data, particularly in relation to the size and distance of geological features on Mars.
From Mars to multidimensional data analysis
NASA has always played an important role in the history of virtual reality, and was instrumental in developing the technology in the early 1980s. Today, the US space agency continues to rely on VR. For astronaut training, NASA worked with Epic to develop a Mars simulation in VR. But VR is also helping to better understand the Red Planet.
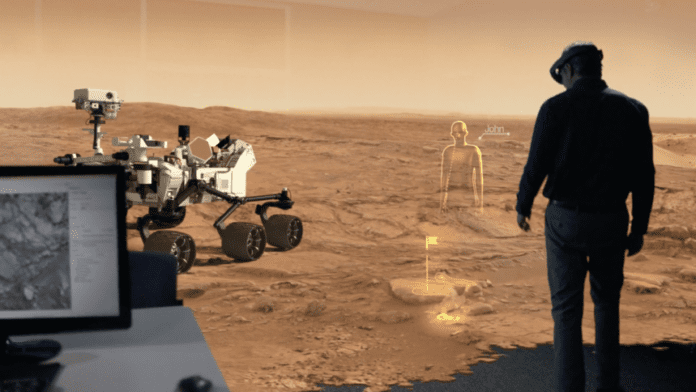
Scott Davidoff, head of the Human Centered Design Group at JPL, and his team are bringing footage from the Curiosity Mars rover into VR to give scientists a more realistic view of the Martian landscape. “Looking at pictures on a screen is a much different experience to walking through a canyon,” says Davidoff.
Compared to viewing images on a flat screen, distances, and sizes of geological formations can be determined more quickly and accurately in virtual space. This experience led to the idea of displaying complex multidimensional data in a similar VR environment.
NASA creates a virtual data world
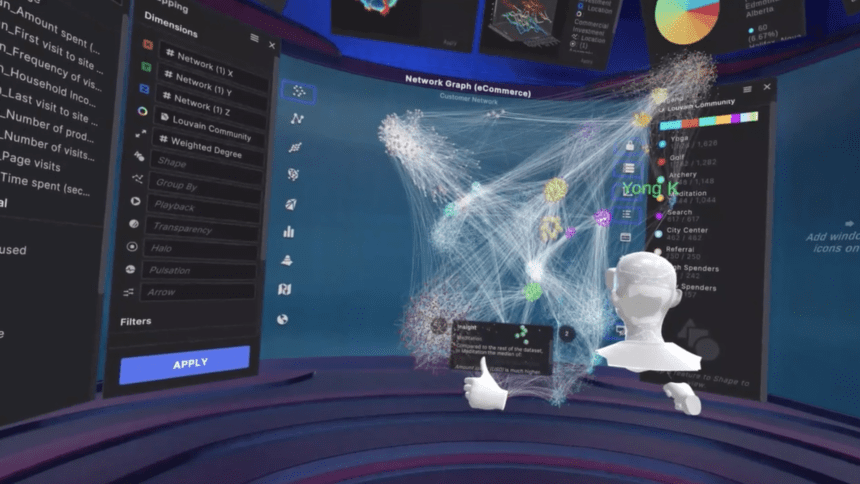
“When you look at a network diagram as a system in 3D, it turns out your perception does something different,” says Davidoff. “We made a data world where an analyst could look at any science or engineering problem and see patterns and correlations more clearly than they can in a flat version”
Working with Ciro Donalek and George Djorgovski at the California Institute of Technology (Caltech), they developed software that uses 3D visualisations to explore relationships between data points. In 2016, they co-founded Virtualitics Inc. with Davidoff in an advisory role.
Advanced data analysis with AI and VR
Virtualitics’ main product is software that combines artificial intelligence with 3D visualization. It allows users to see patterns and relationships in their data faster than is possible with traditional 2D charts.

The software is compatible with several current VR headsets and can be used both on the desktop and in VR. It is currently used mainly in banking, retail and medical research.
Data volumes ranging from spreadsheets to large databases can be processed without the need to move the data from its point of origin.
Sources: NASA


